Summer So Far

Well, I just realized I haven’t posted to this blog yet this summer, even after rededicating this blog to looking at math-specific ed tech.  I will get to that soon!  So here are my excuses….

So I’ve been busy.  I finished collecting (and almost done analyzing) my data for my practicum project on newer graphing technologies. I hope to have a rough draft of my results section done in two weeks.

Last week, I worked the Getting To Know CMP Conference (#GTKCMP14) at Michigan State University. It was a great week working with about 210 teachers from around the United States (and even Mexico).  The work I do at this conference is minimal, but sitting in and listening to the interactions between new and experienced teachers of CMP is priceless.  So many “ah ha” moments for teachers of all levels of teaching experience.  It is the best PD out there, in what may be my biased opinion.

Throughout summer, I have been working on creating apps for CMP that are specific to the problems within the text.  I am working with another graduate student on this and we are going through the growing pains of finding the best way to create these tools that will be most beneficial to teachers and students.  We are trying to make a really good teacher and parent support pages on our new website, because we don’t want new and experienced teachers going crazy trying to teach with a new (or revised) curriculum and we want parents to be able to support their child’s learning of mathematics.

Beyond that, I made it home to Kalamazoo once for Mother’s Day and have only made it to Detroit once for a Tigers game.  That needs to be fixed.  Here is a picture of me with Paws, the Detroit Tigers mascot:

Image

Goals for the rest of the summer:

  1. Finish my practicum (I want that thing off the to-do list so I can just concentrate on comps.)
  2. Finish apps for the first two units of each grade level of CMP by the end of summer.
  3. Lose some weight.  During the past two years of working on CMP3, I’ve put on roughly 30 pounds, or what I like to call my CMP30, from sitting in front of computer monitors for hours on end and eating whatever sweets the authors brought in to keep us there and not go insane.  Now that revisions are done, I can go to the gym and be outside more regularly.  Maybe even hit a golf ball or two.
  4. Go to the Packers Shareholder meeting at the end of July (I deserve a vacation, especially since I haven’t been on one since I started grad school and especially the last two summers being shot due to CMP3 revisions).
  5. Hit up one more Tigers game (and maybe even make it a road game).
  6. Write my first blog post around math-specific ed tech.  I think I would be best to take an in-depth look at MP5: Use appropriate tools strategically to hash out what it really means and what I have experienced/observed recently in how technology is being implemented (good and bad) in mathematics instruction.

That’s it for now.

Leave a comment

Filed under EdTech, MathEd, Packers, Tigers

My Reflection on #NCTMNOLA

So I spent the last week in New Orleans for both NCSM and NCTM.  This is not my first trip to these conferences but the results seem to be the same: the food was great (I had gator twice and jambalaya three times), some great sessions, many not-so-great sessions, and an exhibit hall that me shaking my head.  Overall, I left New Orleans concerned with what it means nowadays to use technology in mathematics classrooms.

My Session 

I began my week at NCSM on Tuesday with my session on Beyond Graphing Calculators: Using Technology to Facilitate Classroom Discussions in the Common Core Era (PDF of PPT found here). My co-speaker and I have done variations of this talk at other conferences the past few months, but it wasn’t until receiving some much-needed feedback from the Math in Action Conference at Grand Valley State University that made me think about how the typical technology session is really good at showing the availability of apps and programs that can be used in mathematics classrooms, yet not really good at showing why one would even want to use it in the first place.  In particular, what does using a particular type of technology afford in the teaching and learning mathematics that either a) other technologies do not afford, and/or b) teaching without technology does not afford.  I had actually been thinking about this statement long before I received it as feedback, as I applied the month before to the MCTM conference with a session on technology that attends to students’ misconceptions of static representations in algebra and geometry.

So after presenting what I thought we were going to present twice in the past two months as practice for the NCSM conference, I told my co-presenter the week before that I wanted to change up my portion of the presentation.  I wanted to take a look at technologies that could be used not only for classroom discussions, but also focused on doing something mathematically that other technologies, in this case handheld graphing calculators, could not (at least older versions).

What I hoped the salient points of the talk was that even among teaching the same concept, there are aspects of different technologies that work better in some cases than others.  I showcased this by looking at the differences between vertical translations of linear functions compared to quadratic functions.  The different types of student misconceptions led me to choose different graphing technologies for each (desmos.com for linear translation and geogebra.org for vertical translation) to harness the features of one that the other didn’t possess.  Long story short, teachers need to be aware of multiple technologies that seem to attend to similar capabilities and features and understand the similarities and differences between them.  Having this type of knowledge will help teachers to strategically use the appropriate tools that are available to them, whatever the concept may be.

Besides the small snafu that occurred with the two GeoGebra apps that I had open before the tech person came into the room to resize the projector output that made me lose my sliders, the session went well.  I had a handful of people approach me throughout the week and tell me that they enjoyed the session because it focused on why they should use these technologies to begin with. They were especially pleased with the session later in the week after they attended other technology sessions that were scripted on what I was trying to get away from: “here is a technology and here is how to use it”, which justified my last-minute change.

Conference Sessions

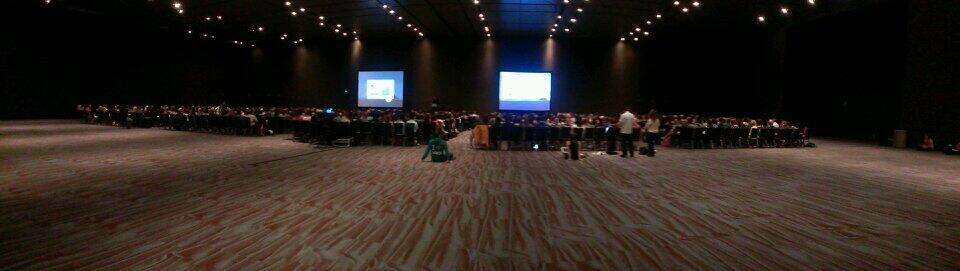
I attended quite a few sessions over the week with a focus on technology.  Most of the session were either on tablet use or on using web 2.0 tools.  Some good, some bad.  I even got in a Dan Meyer presentation on gaming:

danmeyer

Panorama from Dan Meyer’s gaming talk. If he gets any bigger, they’ll need to rent out an airplane hangar at hosting city’s airport.

Two of the sessions I attended really stuck with me and probably will for quite a while.  The first was a session that focused on a technology-in-mathematics-education course that was part of a preservice math ed program in the U.S.  I saw this in the listing and I had to go to it.  Not all undergraduate programs actually have a class that is totally dedicated  to technology use in mathematics classrooms and I happened to attend an undergrad program that did during my undergraduate years at Western Michigan University (Go Broncos!).  The course I took at WMU on technology in math ed was one of my favorite courses during my undergrad and propelled me to transform my thinking as a teacher in how technology can be faithfully implemented in the classroom.  When I took this course back in 2001 or 2002 (so old I don’t know anymore), the focus of the class was on using TI calculators, which at that point in time made a lot of sense.  We looked at capabilities of the graphing calculators beyond the basic graphing and tables features, but included programming on the device.  Long story short, I’m no expert on preservice courses that center on technology use in math classrooms, but I have an experience of being in one that many students may not get in their undergraduate work.  (Note: At WMU, we also took a required non-Euclidean Geometry course that used Geometer’s SketchPad throughout the semester, so that is were we got our exposure to geometry software and why it wasn’t included in the technology course.).

I am currently attending grad school at Michigan State and I find it somewhat concerning that they don’t have a dedicated technology course for preservice math teachers, but it is hard to incorporate an additional class into a program plan that already requires most math work to be done by the fourth year and a full year of method courses during the fourth year and a dedicated year of internship teaching during the fifth year of the program.  There is just no place to squeeze it in.  We try to incorporate technology as much as we can in the method courses, but it seems to be insufficient, and at times superficial, as we have many other things to attend to in the methods courses.

Looking at the session description, I was sort of salivating as I expected there to be talks about many of the new technologies that have been implemented over the past decade+ and how they can make teaching and learning mathematics a better experience for all.  I entered the room enthusiastic about what I was going to see.  I left the room slightly concerned at what I saw and wondered if it was normal in other teacher prep programs. [Next weeks’ blog post will be exploring what I saw during this session, what I think I gained from viewing the session, and how it relates to MP5].

The second session was actually a panel on leveraging technology in the classroom that included panel members Karim Ani, Ashlii Black, Chris Hunter, Dan Meyer, Kate Nowak, Raymond Johnson and moderated by Jon Wray.  After they batted around NCTM factoids and its stance on technology as a form of professional development, they got on track to what the session was supposed to be about: technology in the classroom.  A statement made by a few of the panel member was that one thing that teachers want isn’t necessarily general math apps, but apps that align with problems within the curricula they use.  My main work responsibility with working on CMP at MSU for the upcoming summer and 2014-15 school year will be to create apps that are aligned to specific problems within the curriculum.  So that was really refreshing to hear that what I having been doing and will continue to do is actually something that teachers desire.  I just hope that we can find ways for teachers to know about them, because the last thing teachers need is another resource to check out during their planning.  All I can hope for is that what I am creating moves to the top of their resource list when planning.

One of the things brought up by an audience member was who would take the charge of being an unbiased reviewer of math edtech.

There are a ton of math apps and programs out there now and teachers don’t have the time to download them all, monkey around with them, find the pros and cons of each, and select the “best one” from their limited experience with them.  They really do need the Consumer Reports for math edtech so that they can make quick decisions on what technologies to use in their classrooms.  That type of unsolicited fun requires somebody who loves to look at these types of things, possibly even studies these things, and has the time to sort out the similarities, differences, affordances, and constraints of each and spend some time to write about it.  It may require someone who studies technology and mathematics in tandem and works with them in some way, either through teaching with these tools directly in the classroom or by teaching through connected means (but not in person).  After pulling an all-nighter (up 33 consecutive hours) in order to catch an early flight home from New Orleans to Michigan and not being able to sleep on the shuttle bus from DTW to East Lansing due to a gang a crying toddlers, I think I may have identified that particular person: me.

The Future of this Blog

I will try my hardest to blog about something math edtech related on a weekly basis (might be a bit bumpy the next three week though as I am finishing out the semester).  I feel good about the weekly part.  I think it can be done.  I have other responsibilities, such as completing my practicum paper and writing a comps paper over the summer and fall, but I think writing on this blog weekly is feasible.  Don’t expect anything on a Wednesday night because that is when I play team trivia with the rest of the #PrimeSteeleheads.

I have a feeling it is going to start out like this:  I will begin by writing about the session I mention above and how it relates to the Standard for Mathematical Practice MP5: Use Appropriate Tools Strategically and attempt to determine what this means.  Of course, this will be my opinion, but I think analyzing this session will help me dive into that.  I think it is important to take a look at MP5 because it will probably be the basis for all the evaluations of math edtech from here on out.

In order for me to get inspired in doing this blog every week, I need to get responses from readers.  Please comment with whatever at the end of a blog post.  It could be a reaction to the blog post (positive and negative welcomed, I guess that’s what typically happens) or it could be a request for me to look into something for a future blog post that you as a teacher just don’t have time to dig into with your busy schedules.  This blog won’t go anywhere if I don’t get participation.  I have never really done a legitimate blog before (you can see I posted about 3-4 posts total over the last two years on here prior to this post) so don’t get on my case if I do it poorly at first.  I’ll gladly grab my golf club and go hit golf ball somewhere in lieu of writing.  Writing is one of the reason why I picked math as my major (somewhat of a true story) but now I have to write all the time for my PhD program.   However, I do feel there is a definite need for a type of unbiased review of math edtech that was talked about during the NCTM panel, so I just hope the time I put into this blog will be supported by viewership and, more importantly, feedback and that I can stay somewhat unbiased (I already have favorites, just like everybody else, so it won’t be absolutely unbiased).  Ultimately, I hope teachers use this blog as a way to select appropriate math edtech for particular content in their mathematics classrooms.

Here are some questions that I think are a good basis for when I look at a new math edtech item:

  • Why would I want to use this technology in my math classroom?
  • What does using this technology allow me to do that other technologies (or no technology) do not? Affordances? Constraints?
  • How does it compare to similar technologies? What are the differences between them?

If you have any additional criteria to include here, let me know.  I’m definitely open to suggestions here.

So here we go…

1 Comment

Filed under EdTech, MathEd

MathTwitterBlogosphere Post #1

I haven’t taught for a few years now since I decided to go to grad school full time.  But one of my favorite things to teach occurred during the time we explored exponential growth & decay in my Algebra II classes.

I liked to teach them something that goes a little bit farther than what I consider to be weak real-world exercises located at the end of the problem sets.    Although questions like investing $200 into an account that earns 5% interest compounded annually are nice mathematically, that single instance is not a practice that occurs only once in a person’s life.  In fact, most people will have to save money throughout their working careers, so they will have many of these “one time” investments.  What I feel is left unexplored in many math classes is how these investments and the duration of these investments impact one’s total investment portfolio.

So I decided to look at contributing to a Roth IRA that made 8% compounded annually with the maximum contribution made each year.  We actually used my age as a basis (I was 25 the first time I did this project) and we stopped making contributions at the age of 60, which I assumed to be my retirement age. (I believe 62.5 years old is when you can start withdrawing money from a Roth IRA without penalty, but don’t quote me on that).  Then we also began other Roth IRA accounts if I hypothetically began at the ages of 30, 35, and 40 and looked at how waiting to invest has an impact on total portfolio value when I reach 60 years of age.  When I began teaching in 2004 in Indiana, the maximum contribution to a Roth IRA was $4,000.  A few years later (2008), the maximum contribution was increased to $5000.  So my contributions for the first few years were different than the other years, but it really didn’t impact the generalizations we were able to make later on.

So my students were wondering how rich I would hypothetically be if I invested the maximum contribution from year-to-year.  So my students decided that they had to treat each year as one of the problems at the end of the section.  They just had a different amount of years between the contribution and the age of 60.  So they still got to work on exponential growth at the level the curriculum intended, but also got a much larger picture of what happens when one combines multiple investments.

Image

What they found out after they decided to put all this information into a spreadsheet is that I would have invested $177,000 of my own money and would have just shy of $1 MILLION by the time I was 60.  But the best part was what they saw next.

If I waited until I was 30 to begin investing, I was not getting the five amounts that were listed from when I was the ages of 25 to 29.  The roughly $60,000 I was earning those years (remember there was a max contribution shift) was not included, so I was losing out on roughly $300,000 if I waited five years.  They noticed that the amount that I had if I began at the age of 30 was around $666,000.  So from being just shy of $1,000,000 if I started when I was 25, they proposed that if I waited five years, I would have roughly 2/3rds of what I could have had if I started five years earlier.

Looking at the chart that begins at the age of 35, they made the same generalization of 2/3rds from that of if I started at the age of 30.  They also compared it to beginning at 25, which they said the 2/3rds rule would be applied twice, or (2/3)^2 = 4/9.  So waiting 10 years after 25, I would have a bit less than half of what I could have had.  And waiting until I was 40 to begin (gulp) was roughly (2/3)^3 = 8/27, or about 30%.

I thought the 2/3rds generalization was the best, because I didn’t go into this lesson with that in mind.  It was a generalization that my students came up with.  And because it was their generalization, it was really eye opening for them to think about their own financial future.  They realized that they didn’t have to be rich in order to end up with a lot (relative) of money.

This lesson covers a real-world problem that involves exponential growth (each year total).  Looking at the combination of contributions over a working lifetime was an added bonus, something that many math courses or finance courses do not teach.  In all honesty, I believe that this is some of the most important mathematics that students should learn during their high school careers, but stressing that importance is often not done in this manner.

We also explored other exponential situations like values of vehicles as they age, house values in this manner.  But by far, the Roth IRA investigation is my favorite.

Kevin Lawrence

@kalawrence9

10 Comments

Filed under MathEd, Uncategorized

A Camera in Every Classroom?

So recently I read an article about Bill Gates wanting to install a camera in every classroom.  I found this idea interesting but impractical.

First of all, the cameras are for…….evaluation of teachers (as I said earlier, Bill Gates).

So if you are or have ever been a teacher, think back to the evaluation process you went through.  If you are not a teacher, you are or were probably a student (odds are high on this one).  How often are teachers evaluated?  When they are evaluated, how long are those who evaluate in the room?  Odds are, you probably witnessed somebody in the room once or twice a year and they were probably not there for the entire class period.  I remember being evaluated once for 15 minutes in an 85 minute class period.  I was given a 2 out of 5 for technology use in the classroom because I did not use technology for a 15 minute span. I am currently a PhD student in Mathematics Education at Michigan State University with a research agenda that hangs around the use of technology in the mathematics classroom.  I’ll let you do the math on whether or not that 15 minutes of time my principal was in my classroom  was indicative of what goes on in my classroom outside the time of her visit.

So maybe the camera will give evaluators more access to watch me teach and maybe see that I actually used technology during that class period and others.  Hopefully, they watch the videos for more than the 15 minutes that I was observed.  So do we need a camera in every classroom?  Does having a camera in every classroom mean teachers are going to be video taped all the time?  If I am only worthy of 15 minutes of time during the heat of the battle, what makes one think that entire lessons are going to be viewed over video?  Also, are these video cameras to be on record for every class period?

One of may favorite parts of this article is:

Anya Kamenetz of Fast Company reports that in a TED Talks Education special airing on May 7 on PBS, we can expect to hear more about Gates’ plan. The hope Kamenetz writes, is for teachers “to be filmed in action so they can be evaluated and, maybe, improve.”

I really like that last quote……if “be evaluated” and “improve” were switched.

“to be filmed in action so they (teachers) can improve and, maybe, be evaluated.”

Doesn’t that seem like a lot better use of putting a video camera in every classroom?  I think improving instruction will trump any arbitrary and subjective evaluation any day.

Image

Leave a comment

Filed under EdTech

Review of three interactive whiteboards on iPad

I was invited to co-present a session at the MCTM conference in Traverse City, MI about the use of student work as formative assessment and as a learning tool.   Particularly, I was asked to talk about how technology may be used to fit these needs.

As a presenting group, we settled on basing our presentation on using the task below from the Connected Mathematics Project (CMP).  We had some ideas on how students might respond to this and made so pseudo-student work to go over with the attendees of the presentation.

So in thinking about what types of technologies might be the most useful in answering these questions, I decided on focusing on interactive whiteboard on tablets.  Many schools are making the move to one-to-one computing, with these schools deciding between laptops, netbooks, or tablets.  I thought that what was asked of the students here would elicit some written mathematics and

Leave a comment

Filed under EdTech, MathEd

GeoGebra App for Google Chrome

Recently, GeoGebra released a Google Chrome app which runs in the Google Chrome browser.  Actually, it’s just a link that goes to http://geogebraweb.appspot.com/.  Not sure if it runs in other browsers, but Chrome is pretty much all I use, with the exception of Firefox for a few features that ANGEL (Michigan State’s online class management system) doesn’t do so well when in Chrome.

I think that one of the coolest things about the Chrome app is that you can set it up to save files with your Google Drive (Docs) account, you just have to give it permission to do so.  But by doing this, there is no need to save to your computer and try to find where you put it.  And of course, since it is on Google Drive, it is easy to share with others as you would any other type of Google document.

The look of the GeoGebra Google Chrome app looks very similar to the non-web version of GeoGebra.  It has the same object menu on the left (default), graph area to the right, and input at the bottom.  The only thing that I found functionally different from the non-web version is that the right click is non-existent in the Google Chrome app.  I ran into this issue when trying to make a graph to use in a paper.  The issue with this is that in the non-web program, the right click was needed to change the scale of the graph.  In the app, there is no other way (at least I couldn’t find another way) to scale the graph.  So basically, you get what you get and can only manipulate by zooming in and out.  But zooming only gives cookie-cutter scales and don’t afford the option of creating any scale.

I tweeted GeoGebra about this:

I did this two weeks ago and still haven’t received a response on it yet.  Maybe they are working on it and will be updating it soon.  Regardless, they have been active on their Twitter account, so why I am getting the silent treatment is beyond me.

Leave a comment

Filed under EdTech